


Create Content using JSON data in Figma
Utilise Data Sync plugin in Figma to let our design sync with real data from an external source


Introduction
It starts when I wonder if there is any way for us to use real data from an external source to be the data source of content in Figma. The scenario is simple, I already have the design template for this content. Then whenever there’s an update to the information, I just re-sync it again with the new data… and voila! There’s new content with new updated information on it.
Get Started
At least, we need to prepare these things:
An open data access in XML/JSON format that is publicly accessible
Pre-defined template in Figma
A Figma Plugin to sync our design with the data from an external resource
The Case Study
We will create an earthquake announcement from the latest data that we can get from Indonesian Meteorological, Climatological, and Geophysical Agency (BMKG) open data.
First, let's prepare the data source
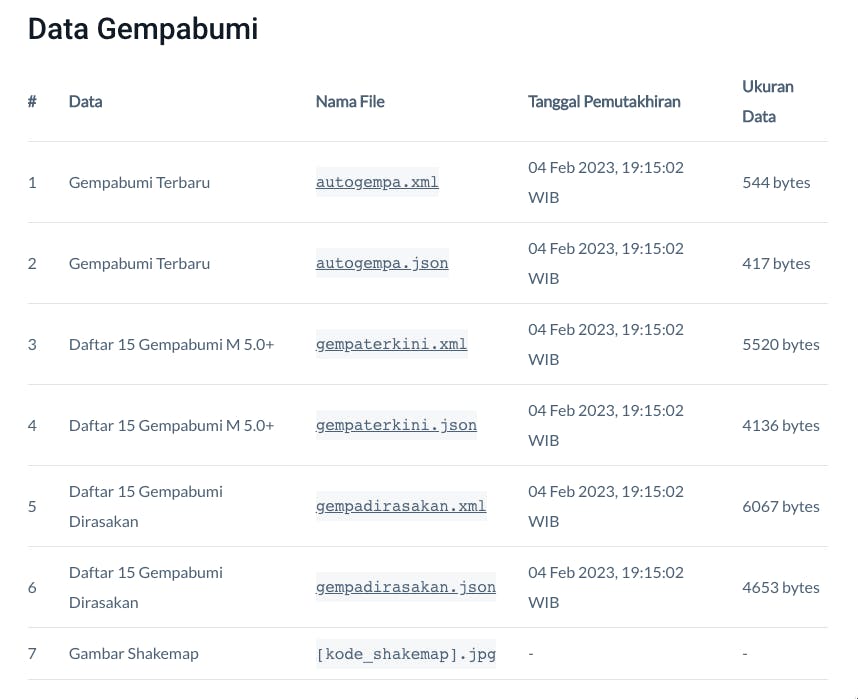
BMKG provides several earthquake data in JSON and XML format that is accessible from this page. In this case study, we will use the "Latest Earthquake (Gempabumi Terbaru)" JSON data (link). Here is an example of the data:
{
    "Infogempa": {
        "gempa": {
            "Tanggal": "04 Feb 2023",
            "Jam": "11:39:24 WIB",
            "DateTime": "2023-02-04T04:39:24+00:00",
            "Coordinates": "-2.54,140.69",
            "Lintang": "2.54 LS",
            "Bujur": "140.69 BT",
            "Magnitude": "2.7",
            "Kedalaman": "10 km",
            "Wilayah": "Pusat gempa berada di darat 9 km TimurLaut Kota Jayapura",
            "Potensi": "Gempa ini dirasakan untuk diteruskan pada masyarakat",
            "Dirasakan": "II Kota Jayapura",
            "Shakemap": "20230204113924.mmi.jpg"
        }
    }
}
For another type of data, you can directly go to this link: Data Gempabumi BMKG.
Next, we prepare the content template
Note: Feel free to make your own version of the design :)
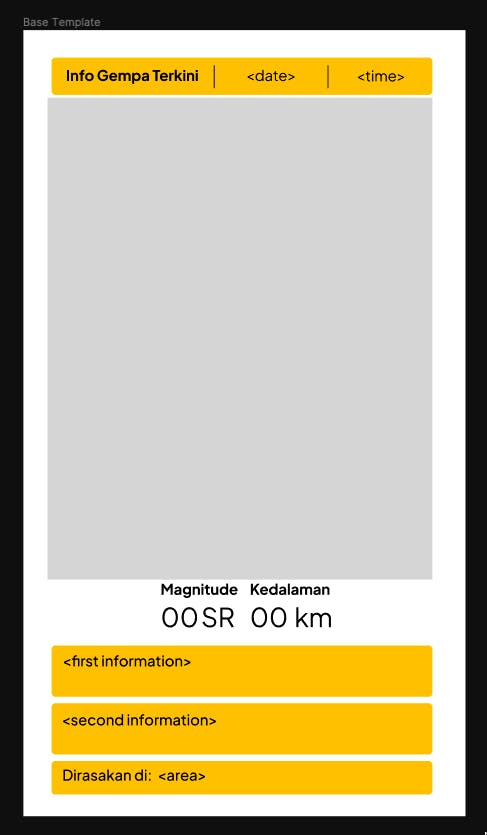
For this design, I decided to use some of the available parameters including the image. There are:
Date
Time
Shakemap
Magnitude
Kedalaman
Wilayah
Potensi
Dirasakan
Some tips, you can put the real dummy content first to estimate the right amount of space for your content. Then, you can replace it with placeholder text.
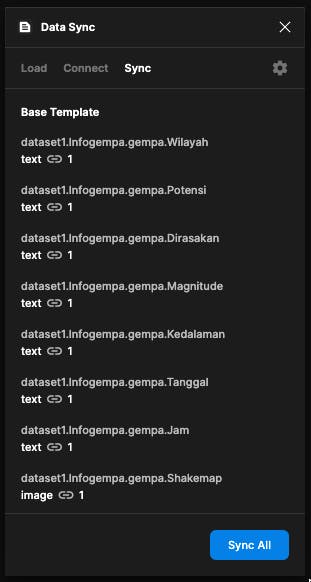
Sync the data with the content
For this part, we will use a Figma Plugin called Data Sync (link)
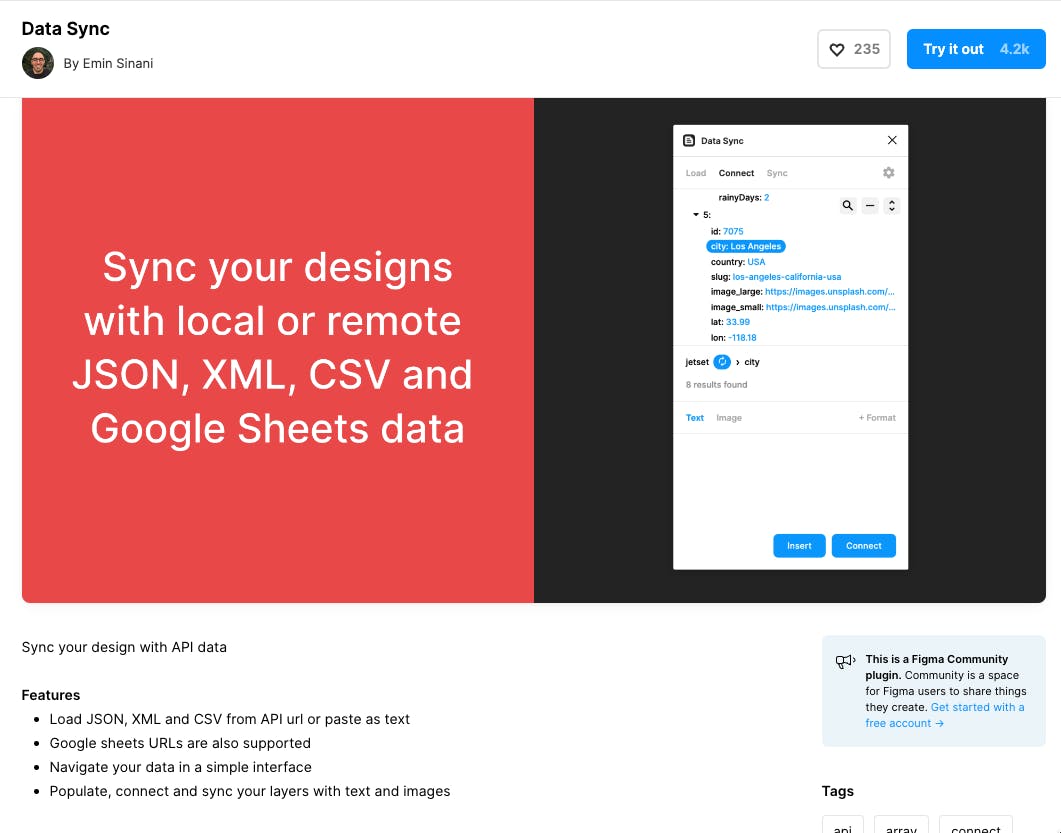
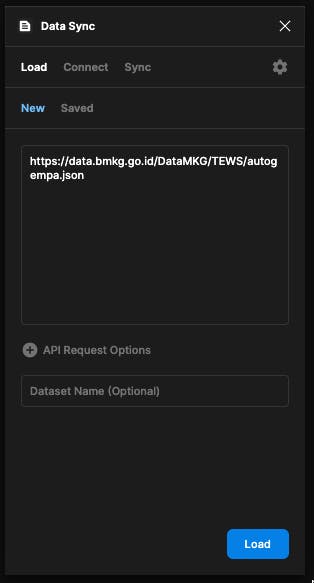
This plugin will help us load JSON data from an URL and sync it to our layers with text and images. Let's try it in Figma! We will load the data first by putting the JSON URL in the plugin, then click load to populate the data.
Next, is the fun part. We will connect each parameter (as needed) to our placeholder. It can be done by clicking one of the parameters -> click on one of the placeholders that you've created previously -> click the connect button. Do it to all placeholders and you may adjust a bit the design if necessary to make sure they fit perfectly.

Last but not least, we are also able to put an image. Before we do this, make sure you already create a placeholder for the image, using a rectangle box should be okay. Adjust the dimensions to fit with the image from the data.

Since on the JSON data we only get the filename, then we need to put the URL of where the image being hosted. To do this, click the "Shakemap" parameter first --> change the type from text to image --> then add the URL format as in the example below
'https://data.bmkg.go.id/DataMKG/TEWS/' + $value
Click connect to finish this process, and you will see the image placed to your design.
Done!
Now the content that we make from the BMKG open data can be seen in the form of an earthquake announcement.

To re-sync / update the data, simply go to the "Sync" tab and click "Sync All" to get the latest data from the provider.
épilogue
With this approach, you can simply sync real data to your design. There are a lot of use cases that can be done, and it will be perfect for those who need to generate regular content like news headline covers, social media posts, etc.
For further exploration, we may consider making the design more responsive and able to make multiple contents based on the available data.